Switching Analysis Software DS-821
(for DS-8000 Series)
High-voltage and high-current signals with increased speed can be measured at high resolution, and the analysis method can be changed according to the characteristics of the device.
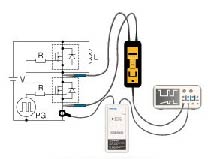
Example of switching analysis measurement
Main functions
The switching analysis software for the DS-8000 is a plug-in software of the digital oscilloscope DS-8000 Series that analyzes the dynamic characteristics of power devices and displays the analyzed waveforms and results on the screen.
- The analysis targets IGBT, IPM, MOSFET, etc.
- The analysis content displays analysis results based on measured parameters such as turn-on, turn-off, reverse recovery, short circuit, etc.
- Waveform Data, Measurement Parameters File Saving and Reading Functions
- Analyzing the waveform data of the specified range with the cursor
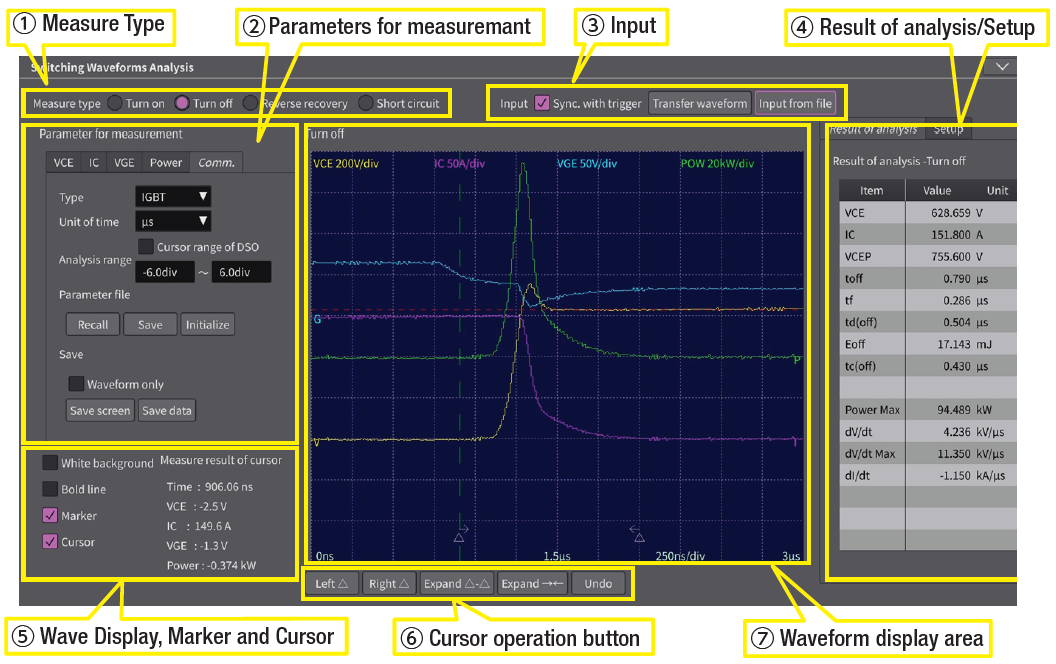
1. Measure type
Select the basic measurement type.
2. Parameter for measurement
Sets the conditions for analyzing and measuring. It consists of 5 tabs, and the name of the tab changes depending on the Measure type.
3. Input
Sets the method to capture the waveform to be analyzed. You can choose how to capture waveforms synchronously with waveform capture operations, how to transfer measured waveforms with the press of a button, and how to read CSV files.
4. Result of analysis/Setup
Displays the analysis result of the dynamic characteristics.
5. Wave display, Marker and Cursor
Sets the manufacturer display and cursor display that represent the setting items and the analysis range related to the waveform display.
6. Operation button for Expand marker
You can operate the zoom marker and zoom in on the time axis of the waveform.
7. Waveform display area
Displays the 0 position of each waveform level read out from the captured waveform or file, the time based on the left edge of the grid display, the horizontal range, and the vertical range.
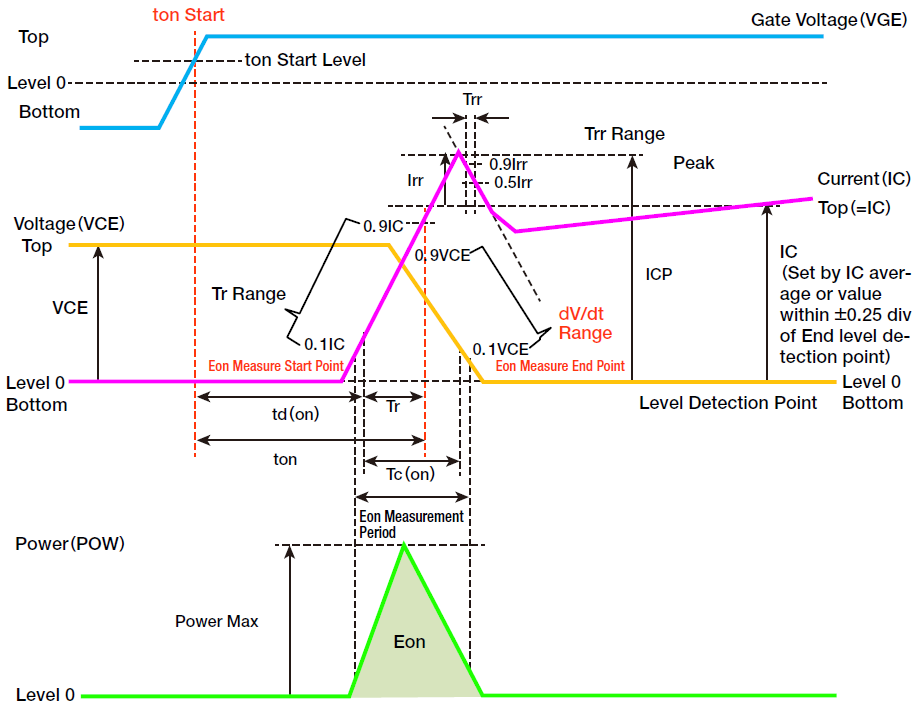
Measurement Parameter Examples
| Analysis result | Explanation | Units | ||
|---|---|---|---|---|
| IGBT | IPA | MOSFET | ||
| VCE | VDS | Top level - Bottom level of VCE or VDS | V | |
| IC | ID | Top level - Bottom level of IC or ID | A | |
| ICP | IDP | Peak - Bottom level of IC or ID | A | |
| Irr | Reverse recovery current. Peak - Top level of IC or ID | A | ||
| ton | Turn-on time. Time /starting point in the following ranges For IGBTs, the starting point is the point above the specified level of VGE. If there is none, it is the starting point of the analysis. For IPMs, the starting point is the point below the specified level of VGE. If there is none, it is the starting point of the analysis. • End point The end point is the tr end point. If there is none, it is the end point of the analysis. | s | ||
| Tr | Rise time. Tr range time. I rise time. | s | ||
| td(on) | - | td(on) | Turn-on delay time. ton - tr | s |
| Eon | Turn-on loss. Energy loss (mJ) of the following range • IC switching loss measurement starting point • End point = VCE switching loss measurement end point | J | ||
| - | tc(on) | - | Switching turn-on time. The range of I rising and V falling (Parameter) time. | W |
| - | Trr | - | Reverse recovery time. Trr range time. Fall time of I protrusion. | s |
| Power Max | Maximum value of Power | W | ||
| dI/dt | Ic Tr range slope | A/s | ||
| dI/dt Max | The maximum value of the derivative of the point adjacent to the dI/dt range (the 3-point moving average) | A/s | ||
| -dI/dt | Falling slope of the Trr part | A/s | ||
| dV/dt | Falling slope of V | V/s | ||
| dV/dt Max | The maximum value of |dV/dt| | V/s | ||
Turn-on Measurement Turn-on Analysis Results Example