B-H AnalyzerFAQ
Introductory Edition Question
- What is the difference between a B-H analyzer and a DC curve tracer?
- What is the difference between a B-H analyzer and an impedance analyzer?
- Some oscilloscopes can also measure magnetic properties such as core loss, but what is the difference with the B-H analyzer?
- What materials and shapes can be measured with the B-H analyzer?
- Can the B-H analyzer measure magnetic permeability?
- What range of magnetic flux densities can be measured with the B-H analyzer?
- What magnetic field (strength) can be excited by the B-H analyzer?
- What frequencies can be measured with the B-H analyzer?
- Can the B-H analyzer measure DC superposition?
- Can the B-H analyzer measure pulse excitation?
- Can the B-H analyzer measure saturated flux density?
- Can the B-H analyzer measure magnetic permeability?
- Can the B-H analyzer measure temperature characteristics?
- Can I measure the change over time in magnetic properties?
- Can the B-H analyzer measure automatic programs?
- What kind of dedicated power amplifiers are available?
- Can I measure without using a dedicated power amplifier?
- Can you provide sample measurements?
Measurement Edition Question
- Why do core loss measurements differ when the number of windings is changed during high-frequency measurements?
- If you increase the value of Bm with sine wave excitation, the measured current or voltage waveform will no longer be in the form of a sine wave and will be distorted. What is the reason for this?
- What number of windings are suitable for measurement?
- What is the appropriate way to wind the sample coil?
- What range of magnetic flux densities can be measured with the B-H analyzer?
- What magnetic field (strength) can be excited by the B-H analyzer?
- Can I measure not only the iron loss of the material, but also the loss including the copper loss of the coil winding?
- What should I be aware of when measuring with the thermostatic chamber scanner system SY-320A/321A?
- What should I pay attention to when measuring with the small single-plate magnetic measuring device SY-956?
- What is the inductance L of the sample that can be measured by DC superposition on the DC bias tester SY-960?
- Each time I measure, the measured value such as core loss changes greatly. What could be the cause of this?
- The measurement results of magnetic properties vary depending on the shape of the core, even though they are the same material. What could be the cause of this?
-
Introductory Edition Answer
- Q. What is the difference between a B-H analyzer and a DC curve tracer?
- A. The measurement principle is the same. The difference is the excitation method. The DC curve tracer excites the sample by changing the output of the DC power supply into a sinusoidal waveform or a triangular waveform very gently over several tens of seconds, and obtains a B-H waveform for one cycle. On the other hand, the B-H analyzer generates a sine wave or a square wave of a set frequency instead of DC from the built-in signal generator, amplifies it with an AC power amplifier, excites the sample, and obtains a B-H waveform for one cycle. The DC curve tracer is suitable for measuring the static characteristics of the magnetic properties of the sample.
On the other hand, the B-H analyzer is suitable for measuring high-frequency characteristics, which are dynamic characteristics of magnetic properties. - Q. What is the difference between a B-H analyzer and an impedance analyzer?
- A. An impedance analyzer is a parameter measuring device for electronic components at small signals (tens of mA), and for magnetic parts, it can measure parameters such as L, Q, R, Z. On the other hand, the B-H analyzer can measure the magnetic properties of soft magnetic objects such as the B-H curve, core loss, and magnetic permeability of magnetic parts from small signals to large signals (5mA to 6A). The B-H analyzer is suitable for measuring magnetic parts under actual driving conditions.
- Q. Some oscilloscopes can also measure magnetic properties such as core loss, but what is the difference with the B-H analyzer?
- A. The function of determining the magnetic field (strength), magnetic flux density, and other magnetic characteristic values from the measured excitation current and induced voltage is the same, but measurement using an oscilloscope and measurement using a B-H analyzer differ greatly in the following two points.
- Measurement resolution of excitation current and induced voltage
- Phase difference correction method between excitation current and induced voltage
Next, in terms of phase difference correction ②, the phase difference between the excitation current and the induced voltage is an important parameter that has a great impact on the core loss. In measurement with an oscilloscope, the time difference between the measurement channels is canceled (deskewed) by skew adjustment, and this phase difference correction is performed. However, due to the fact that the frequency-phase characteristics of the current probe are not linear (the group delay characteristics are not flat), precise phase correction cannot be performed by deskew alone. Some power analyzers have a deskew function, but similarly precise phase correction is not possible.
On the other hand, with the B-H analyzer, frequency-phase characteristics between measurement channels are measured in advance, and this phase difference is precisely corrected for each frequency and for each measurement range. Therefore, the B-H analyzer can measure core loss with extremely high measurement accuracy. The B-H analyzer can measure extremely small core losses of pressed powder-based materials that are difficult to measure with an oscilloscope or power analyzer. - Q. What materials and shapes can be measured with the B-H analyzer?
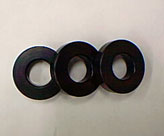
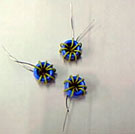
- A. It is possible to measure soft magnetic samples with a windable closed magnetic circuit shape, such as a toroidal, EI, EE core, etc. In addition, by combining with the small single-plate magnetic measurement device SY-956, you can also measure plates and sheet-like samples.
[Reference] Example of measurement sample shape - Q. Can the B-H analyzer measure magnetic permeability?
- A. You can measure it by filling the optional empty toroidal core SY-513 with powder and winding.
- Q. What range of magnetic flux densities can be measured with the B-H analyzer?
- A. In the region where the B-H curve is unsaturated due to sine wave excitation, the relationship between the maximum magnetic flux density Bm and the induced voltage V2 is expressed by the following equation.
f: Measurement frequency Ae: Effective cross-sectional area of the sample N2: Number of secondary windings

Therefore, in the unsaturated region, it is possible to measure up to Bm corresponding to V2 within the detected voltage range of the B-H analyzer used. For SY-8218 and SY-8219, the maximum permissible value of V2 is 200V. Note that this equation does not apply to non-sinusoidal excitation or saturated regions. - Q. What magnetic field (strength) can be excited by the B-H analyzer?
- A. The maximum magnetic field Hm that can be excited is determined by the following equation.
I: Excitation current N1: Number of primary windings Le: Average magnetic path length
The excitation current I depends on the power amplifier used. - Q. What frequencies can be measured with the B-H analyzer?
- A. It depends on the options combined with the B-H analyzer model. The measurement frequencies for each model of the B-H analyzer are shown in the table below. For the measurement frequency based on the combined option, see the explanation of each option.
Model name Measurement frequency SY-8218 10Hz~10MHz SY-8219 10Hz~1MHz
The B-H analyzer can measure up to the above frequencies in terms of performance, but it is necessary to pay attention to the inductance L of the sample for the upper limit frequency.
Since the input capacitance C of the B-H analyzer and the inductance L of the sample form an LC parallel resonance circuit, it is necessary to ensure that the measurement frequency is 1/10 or less of the resonance frequency. Please also take this into account when selecting the model. Note that the resonance frequency fc can be calculated from the following equation.
L: Inductance of sample C: Input capacitance of measurement device (SY-8218/SY-8219 is approx. 18.5pF) N1: Number of primary windings N2: Number of secondary windings
 The effect of resonance is greater in samples with even high phase angles (≥ approx. 87°), so when measuring samples with high phase angles, it is recommended to measure at a frequency less than 1/20 of the resonance frequency.
 - Q. Can the B-H analyzer measure DC superposition?
- A. You can measure by combining SY-8218/SY-8219 with the optional DC bias tester SY-960 (SY-961, SY-962). Since it is not necessary to apply a tertiary winding for DC excitation to the sample, measurements can be made much more easily than in the past.
- Q. Can the B-H analyzer measure pulse excitation?
- A. SY-8218/SY-8219 is limited to Duty 50%, but measurements can be made at 10Hz to 1MHz as standard. In addition, measurements can be made at 10kHz to 1MHz with variable Duty 10 to 90% by combining with the optional DC bias tester SY-960 (SY-961, SY-962).
- Q. Can the B-H analyzer measure saturated flux density?
- A. If the magnetic field (strength) and induced voltage corresponding to the saturated magnetic flux density are within the measurement range of the B-H analyzer, measurements can be made..
- Q. Can the B-H analyzer measure magnetic permeability?
- A. The amplitude specific magnetic permeability and complex magnetic permeability can be measured with the SY-8218/SY-8219. You can also measure the amplitude specific magnetic permeability at any point of the B-H curve by using the curve measurement function.
- Q. Can the B-H analyzer measure temperature characteristics?
- A. You can make measurements by combining with the optional thermostatic chamber scanner system. The following table shows the main specifications of the thermostatic chamber scanner system.
Thermostatic chamber scanner system SY-320A SY-321A Compatible models SY-8218 ○ SY-8219 ○ Maximum number of measurement samples 20 pieces 41 pieces Temperature control range -30[℃]~+150[℃] Maximum measurement current ±6[A] Maximum measurement voltage ±200[V]
When combined with the thermostatic chamber scanner system, the upper limit for measurement frequency is 5MHz. If the upper limit of measurement frequency of the combined B-H analyzer or power amplifier used is less than this, this limit will be the upper limit of measurement frequency.
[Reference] Thermostatic Chamber Scanner System - Q. Can I measure the change over time in magnetic properties?
- A. You can measure it by adding the optional software SY-811 continuous measurement function to the B-H analyzer. The sample can be maintained in an excited state, measured at 1-minute intervals, and the change over time in magnetic properties can be measured for up to 99,999 minutes (approx. 70 days).
- Q. Can the b-h analyzer measure automatic programs?
- A. If you incorporate the optional remote control software SY-810 into your PC, you can perform automatic program measurement with the B-H analyzer alone or in combination with optional equipment such as the thermostatic chamber scanner system. For the main specifications of the SY-810, see the following. Since the communication command for the remote control is not published, the customer cannot make a program and independently measure using remote control with the B-H analyzer.
Equipment that allows automatic measurements B-H AnalyzerSY-8218/8219 Thermostatic chamber scanner system SY-320A/321A Compact Single-Plate Magnetic Measurement Device SY-956 DC bias testerSY-960/961/962 Number of measurement condition settings (per sample) 40 (* For SY-320A/321A) Number of temperature condition settings (per sample) 20 (* For SY-320A/321A) Measurement data save format CSV Measurement screen save format JPEG / PNG SupportedOS Windows 8.1 / 8 / 7 / Vista - Q. What kind of dedicated power amplifiers are available?
- A. We offer a dedicated power amplifier with 4 quadrant output. Select the desired model by referring to the compatibility table below.
- Q. Can I measure without using a dedicated power amplifier?
- A. You can measure with a 4-quadrant output power amplifier, even if you do not use the dedicated power amplifier. The dedicated power amplifier is designed to fine-tune the DC offset adjustment to a range of ±1V and to bring the DC offset to zero without limit. If there is a DC offset, the magnetic characteristics of the unintended DC superposition are measured and an asymmetric B-H curve is drawn. If you do not use the dedicated power amplifier, you should pay close attention to this point. If the DC offset cannot be zeroed, the optional SY-514 LF AC coupler can be used to completely zero the DC offset at a measurement frequency of 300Hz or higher.
- Q. Can you provide sample measurements?
- A. Yes, for a fee. For further information, please contact us. Measurement Edition Answer
- Q. Why do core loss measurements differ when the number of windings is changed during high-frequency measurements?
- A. The first cause of the difference may be the effect of the LC parallel resonance phenomenon. The resonance frequency varies depending on the number of windings. Core loss measurement can be measured if the detected voltage and current are within the measurable range of the B-H analyzer. However, caution is required during high-frequency measurement because the input capacitance C of the B-H analyzer and the inductance L of the sample form an LC parallel resonance circuit. Use the device with a measurement frequency that is less than 1/10 of the resonance frequency. The resonance frequency fc can be calculated from the following equation.
L: Inductance of sample C: Input capacitance of B-H analyzer (SY-8218/SY-8219 is approx. 18.5pF) N1: Number of primary windings N2: Number of secondary windings
The effect of resonance is greater in samples with even high phase angles (≥ approx. 87°), so when measuring samples with high phase angles, it is recommended to measure at a frequency less than 1/20 of the resonance frequency.
The second reason may be the influence of the magnetic field (strength) H inside the sample, or the inhomogeneity of the magnetic flux density B. If the magnetic permeability of the sample is low, the shape is not toroidal, or the winding is not uniform, the size of H, B inside the sample often differs depending on the position of the sample. If the number of windings is changed, the average excitation position of H or the average detection position of B may change, resulting in a difference in core loss. - Q. If you increase the value of Bm with sine wave excitation, the measured current or voltage waveform will no longer be in the form of a sine wave and will be distorted. What is the reason for this?
- A. Waveform distortion occurs due to the sample characteristics. This is because the magnitude of the magnetic flux density B changes non-linearly with respect to the magnetic field (strength) H. The waveform distortion is especially more pronounced when approaching the saturated magnetic flux density of the sample.
- Q. What number of windings are suitable for measurement?
- A. The recommended number of windings is as follows:
Excitation coil N1: 3 or more turns
Detection coil N2: N1 ≥ N2 with 1 turn or more
If N1 is low, a large current is required for the required magnetic field (strength), and if N2 is high, the induced voltage detected increases. In addition, if N1 < N2, the input capacitance of the B-H analyzer from the perspective of the excitation system will be doubled to the square of (N2/N1), and the parallel resonance frequency fc will drop to N1/N2 so caution is required. - Q. What is the appropriate way to wind the sample coil?
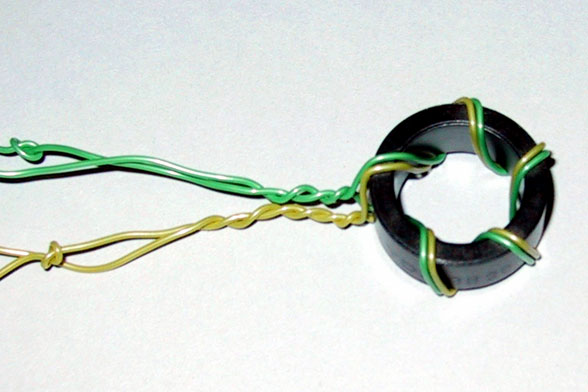
- A. Whenever possible, the coil should be wound at equal intervals on the sample to ensure that the magnetic field (strength) in the core is uniform and that the magnetic flux density detection site is not skewed. In particular, the detection coil should be wound so as to adhere to the sample to prevent the invalid magnetic flux from interlinking in the void between the detection coil and the core. If the excitation coil and the detection coil overlap, the detection coil should be wound first and attached to the sample. If the number of windings of the excitation coil and the detection coil is the same, bifilar winding is recommended. With bifilar winding, the primary winding (excitation coil) and secondary winding (detection coil) are paired, which can reduce the leakage magnetic flux and improve the coupling coefficient between the primary and secondary windings compared to winding separately.
[Reference] Bifilar winding - Q. What range of magnetic flux densities can be measured with the B-H analyzer?
- A. In the region where the B-H curve is unsaturated due to sine wave excitation, the relationship between the maximum magnetic flux density Bm and the induced voltage V2 is expressed by the following equation.
f: Measurement frequency Ae: Effective cross-sectional area of the sample N2: Number of secondary windings
Therefore, in the unsaturated region, it is possible to measure up to Bm corresponding to V2 within the detected voltage range of the B-H analyzer used. For SY-8218 and SY-8219, the maximum permissible value of V2 is 200V. Note that this equation does not apply to non-sinusoidal excitation or saturated regions.
When calculating the value of the induced voltage V2 by determining the value of the target maximum magnetic flux density Bm first, note that the peak value of the actual induced voltage V2 will be 3 to 10 times the above calculated value depending on the saturation state. In order to prevent the destruction of the sample or equipment, you should start the initial measurement at 50-75% of the target maximum magnetic flux density Bm and gradually increase the excitation level. - Q. What magnetic field (strength) can be excited by the B-H analyzer?
- A. The maximum magnetic field (strength) Hm that can be excited is determined by the following equation.
I: Excitation current N1: Number of primary windings Le: RMS magnetic path length
The excitation current I depends on the power amplifier used.
- Q. Can I measure not only the iron loss of the material, but also the loss including the copper loss of the coil winding?
- A. If you measure using the single winding method without the detection coil on the secondary side, the loss including the copper loss of the primary side excitation coil winding can be measured. The B-H analyzer can also perform single winding method measurements.
- Q. What should I be aware of when measuring with the thermostatic chamber scanner system SY-320A/321A?
- A. When measuring samples with low magnetic permeability and low iron loss, such as pressed powder, it is recommended that the sample be placed at least 15mm away from the attached turntable SY-510/511 on which the sample is placed. The base material of SY-510/511 is aluminum. If a leakage magnetic flux is generated from the sample, and it interlinks to the SY-510/511, an eddy current loss will occur there, resulting in an error in the measurement of the iron loss and correct measurement will not be possible.
If the sample is a conductor, it is recommended to further separate the sample by at least 15mm. Likewise, if a leakage magnetic flux is generated from the sample and it interlinks to an adjacent sample, an eddy current loss will occur and correct measurement will not be possible. - Q. What should I pay attention to when measuring with the small single-plate magnetic measuring device SY-956?
- A. One caution is not to create a gap between the measurement yoke and the sample. If there is a gap, a leakage magnetic flux will be generated, and correct measurement will not be possible. Before the measurement, always check to make sure that there is no foreign material on the sample or the measurement yoke.
The second is to minimize the void between the B coil, which is the detection coil, and the sample. If unwanted magnetic fluxes such as geomagnetism and leakage magnetic flux interlink in the air gap, correct measurement will not be possible. Particular care should be taken when measuring samples with low magnetic permeability. - Q. What is the inductance L of the sample that can be measured by DC superposition on the DC bias tester SY-960?
- A. The upper limit of the inductance L of the sample that can be measured with SY-960 is several tens of μH. If you measure a sample with more inductance L, some of the AC supplied by the power amplifier will flow into the DC bias source SY-961 instead of the sample, and correct measurement will not be possible.
- Q. Each time I measure, the measured value such as core loss changes greatly. What could be the cause of this?
- A. In general, soft magnetic bodies have temperature characteristics. In particular, the magnetic properties of ferrite are unstable near room temperature. When making accurate magnetic property measurements of soft magnetic materials, it is necessary to take the measurements while holding the sample at a constant temperature in a thermostatic chamber.
In addition, depending on the material, the magnetic properties may change depending on the excitation time and excitation history independent of the sample temperature. By adding the optional continuous measurement function SY-811, you can observe a change over time of up to 99,999 minutes (about 70 days) of magnetic properties every 1 [min]. If the magnetic characteristics change greatly with each measurement, it is recommended to take continuous measurements with SY-811 to check whether the magnetic characteristics change over time due to the excitation time. - Q. The measurement results of magnetic properties vary depending on the shape of the core, even though they are the same material. What could be the cause of this?
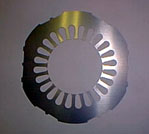
- A. This is because the magnetic flux density distribution inside the core changes depending on the shape. Magnetic flux passes through areas with low magnetic resistance inside the core. Therefore, the magnetic flux density distribution may be uneven, and places with high magnetic flux density may occur locally, showing different behavior compared to when the magnetic flux density distribution is uniformly shaped.
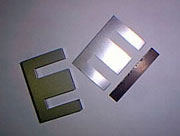
EI core
Dust core
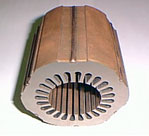
Motor stator
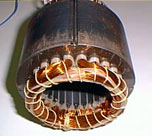
Motor rotor
Amorphous core
Stator laminate