In the past, many items had to be set manually, meaning that measurements took a long time, but by adopting the
Advantages of adoption
- Make accurate and reliable measurements according to the measurement procedure
- Measurement content is also saved as evidence
- Auto-judgment is also possible
- Control of optional products can also be automated (e.g. temperature control of hot plate)
We made an actual comparison (IWATSU comparison)
A comparison was made between automatic measurement (Semiconductor Parameter Measurement Software CS-810) and conventional manual measurement using the same sample.
* For the time of manual measurement, it was assumed that an experienced operator performs the measurement.
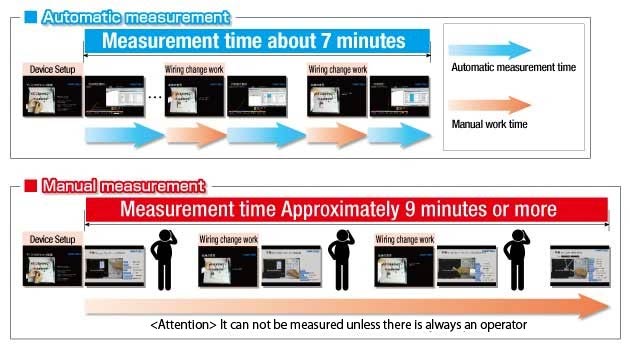
Video of automated measurement using "Semiconductor Parameter Measurement Software CS-810"
Video showing the large amount of time it takes to measure when configuring settings manually (it takes a long time, so 2x speed playback is used)
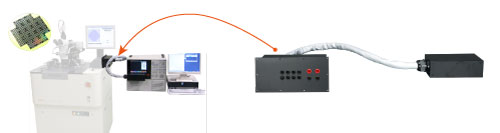
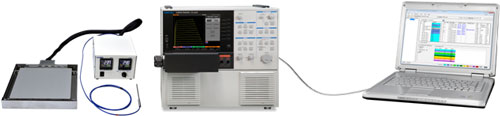
You can also automate “wiring change work.” Scanner System CS-700 Click here for more information
A software option that you install on your PC to control curve tracers, scanners, hotplates, etc. via Ethernet.
The easy setup improves work efficiency by automating measurements with a curve tracer that previously only allowed manual measurements.
Automate measurement, recording, and judgment to improve efficiency of manual sorting and inspection.
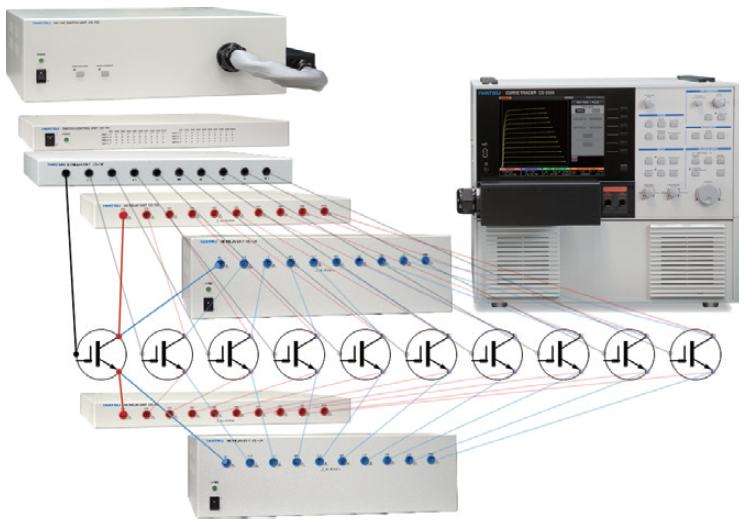
Measure modules and multiple discrete devices while automatically switching between them.
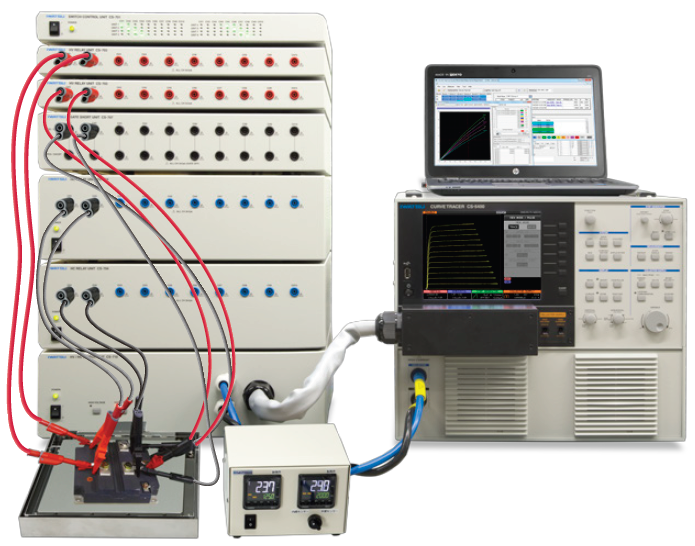
Simultaneous control of the main unit, scanner, and hot plate, as well as fully automatic measurement of the temperature characteristics of the 6-in-1 module.
No programming knowledge required
By loading the settings of the curve tracer measured manually into the PC, the sequence is set, so no knowledge of programming is required, and anyone can easily set it.
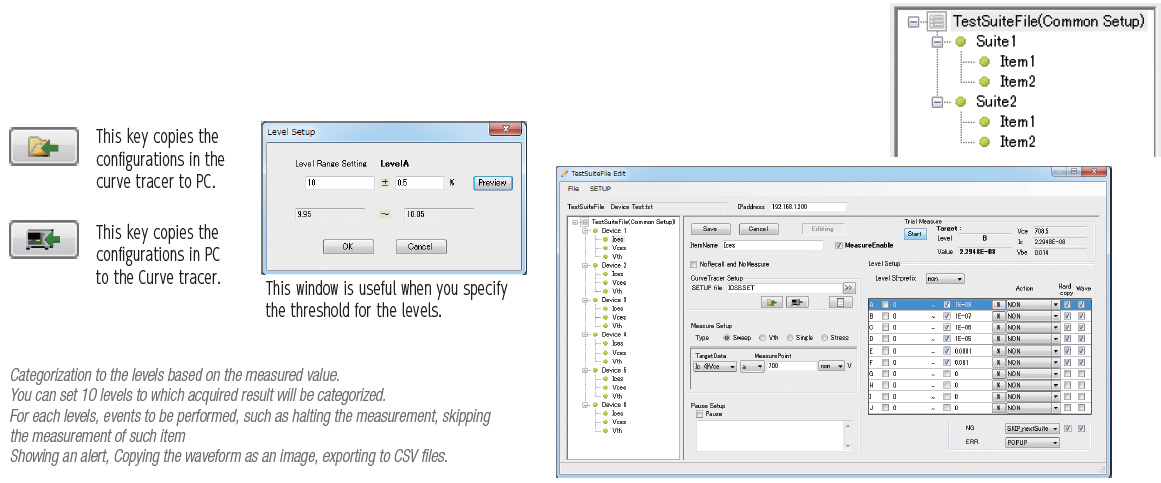
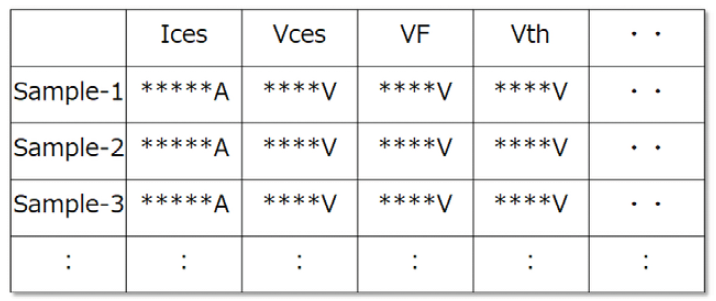
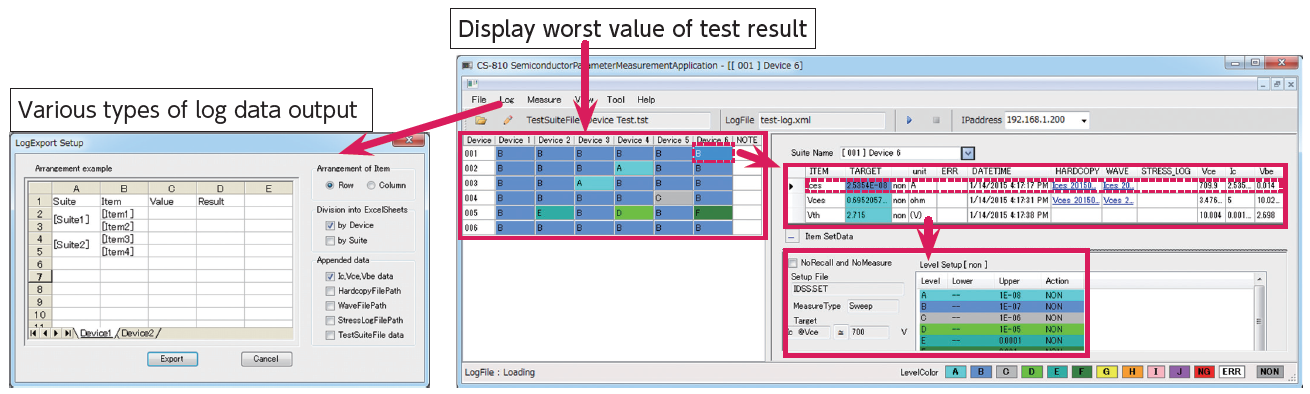
Automatic measurement (leakage current, saturation voltage, VF, Vth, etc.)
Measurement results window
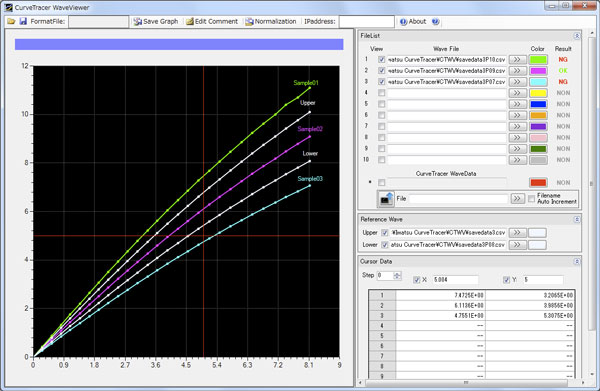
Waveform comparison function
You can compare a large number of waveforms that have been saved after measurement, such as development variation and defect analysis. In addition, you can also judge the quality by comparing the waveforms.
Waveform comparison and judgment
You can judge the quality by comparing the waveform to the reference data.
Waveform display
CSV files and curve tracer recalled waveforms acquired in the past and currently acquired waveforms can be simultaneously displayed and compared on the same graph with a maximum of 10 waveforms.
Rescaling function
Saves the displayed waveform voltage axis to a CSV file at any interval. When the measurement results are displayed in a table, the voltage axes can be aligned.
Cursor functions
Displays the values of the displayed waveform in a list. In addition, the values are displayed by interpolation for points other than the sampling points.
Comment
You can view, edit, and move comments on each waveform.
Save graph image
You can save any combination of graph, file list, and cursor values to an image file.
(Image format:PNG/BMP/JPG/TIFF)
Colorful graph display
-- Settable items --Graph title, plot area background color, cursor color, Line Dot (line only, dot only, line and dot) X-axis, Y-axis: axis title, data selection (Ic/Vce/Vbe), scale (Log/Linear) (Y-axis only), scale interval (Auto ,1-2-5 Step), scale minimum, maximum, grid (display color, hidden)
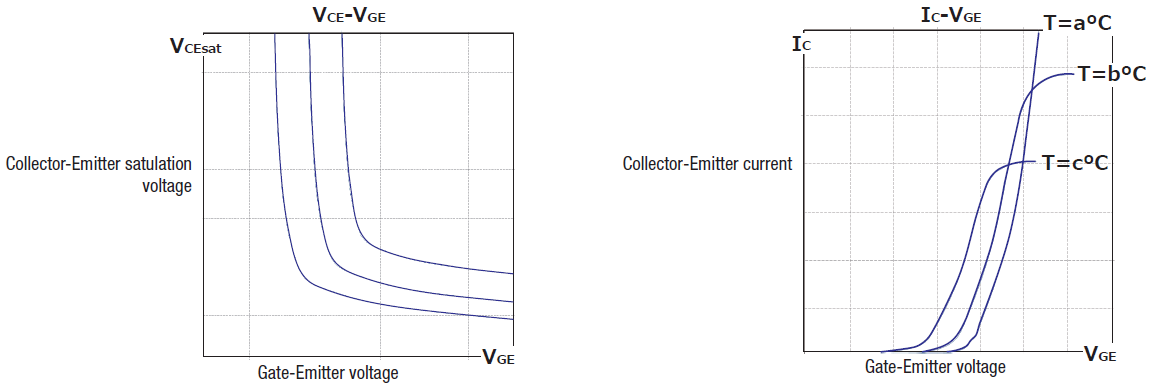
Automated measurement of transmission characteristics
You can automatically measure transmission characteristics with a curve tracer.
Save characteristic curve to file
The measured characteristics are saved in a CSV file, and the graph is saved as image data in a file.
*Image format:PNG/BMP/JPG/TIFF
Cursor functions
Displays the cursor on the X- and Y-axes. The values are displayed by interpolating between the measurement data points.
Graph area customization
You can customize the graph title, axis label, background color, axis range, etc.
Saving and reading settings
You can save the settings of the characteristic measurement and the customization settings of the graph area to a file and call them.
Device testing
Multiple device tests and records can be reliably performed in a short time.Automatically executes multiple measurement items.
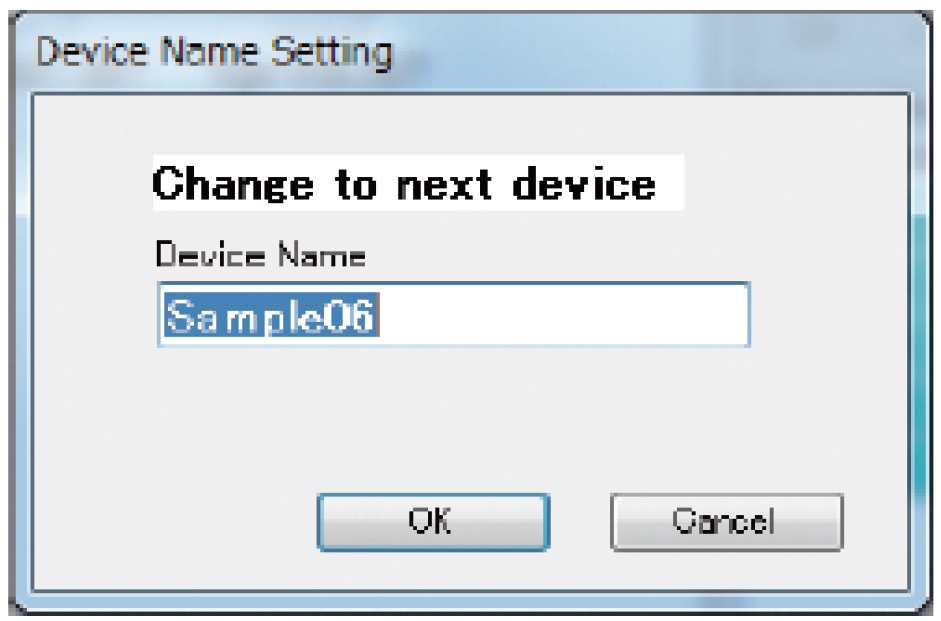
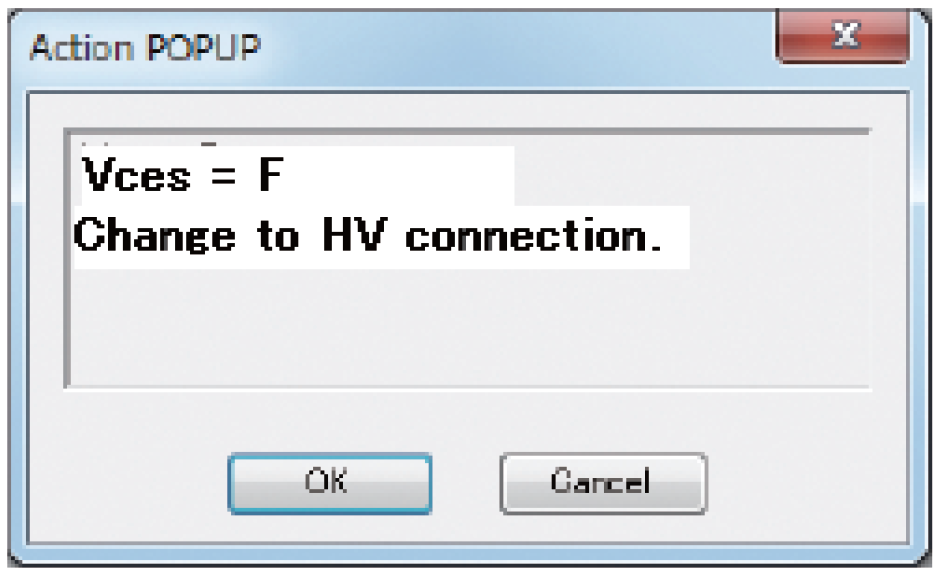
The operator can repeat the measurement under the same conditions by replacing the device, replacing the wiring, or entering the sample name if necessary (with the sample name automatic increment function) according to the information in the pop-up.
The judgment result is displayed for each measurement, and the image and waveform data are automatically saved.
Enter a sample name to set to the test fixture
During the measurement, the measurement value and the judgment result are displayed.
Pause and work instructions pop up according to the judgment result
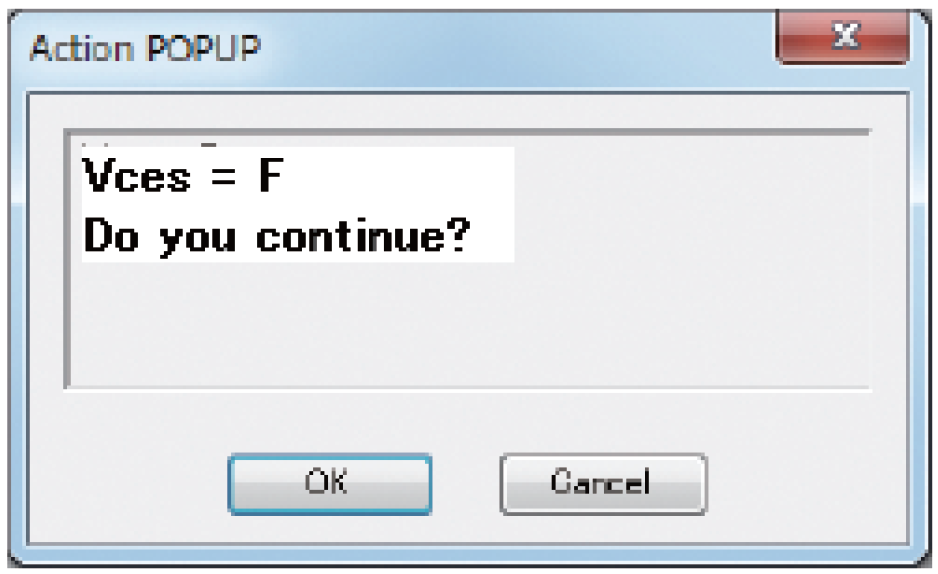
Pause and work instructions pop up according to the measurement item
After the measurement is completed, the LOG file can be exported to CSV or Excel format.
Waveform images and data are automatically saved during measurements.
The stress test logs are saved to a separate file.
You can also select the measurement result from the log display screen and rerun the measurement.
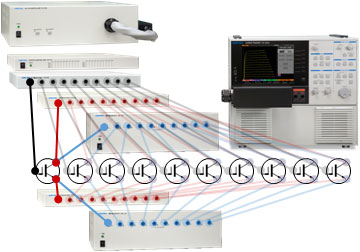
Module measurement
The scanner system is controlled simultaneously with the curve tracer.
You can also control the opening/shorting and HV/HC switching of each element gate, realizing fully automatic measurement of one module without removing the bus bar.
After setting one element, the setting of CS-810 can be easily created by copying the number of elements.
- The gate of the unmeasured element can be short-circuited at the emitter.(CS-707)
Save characteristic curve to file
The measured characteristics are saved in a CSV file, and the graph is saved as image data in a file.
*Image format:PNG/BMP/JPG/TIFF
Cursor functions
Displays the cursor on the X- and Y-axes. The values are displayed by interpolating between the measurement data points.
Graph area customization
You can customize the graph title, axis label, background color, axis range, etc.
Saving and reading settings
You can save the settings of the characteristic measurement and the customization settings of the graph area to a file and call them.
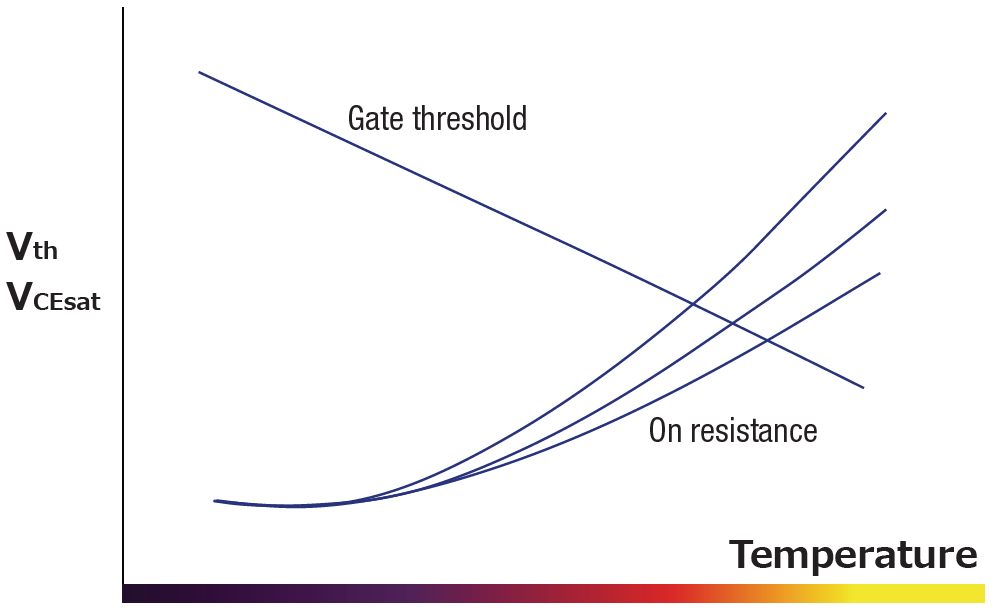
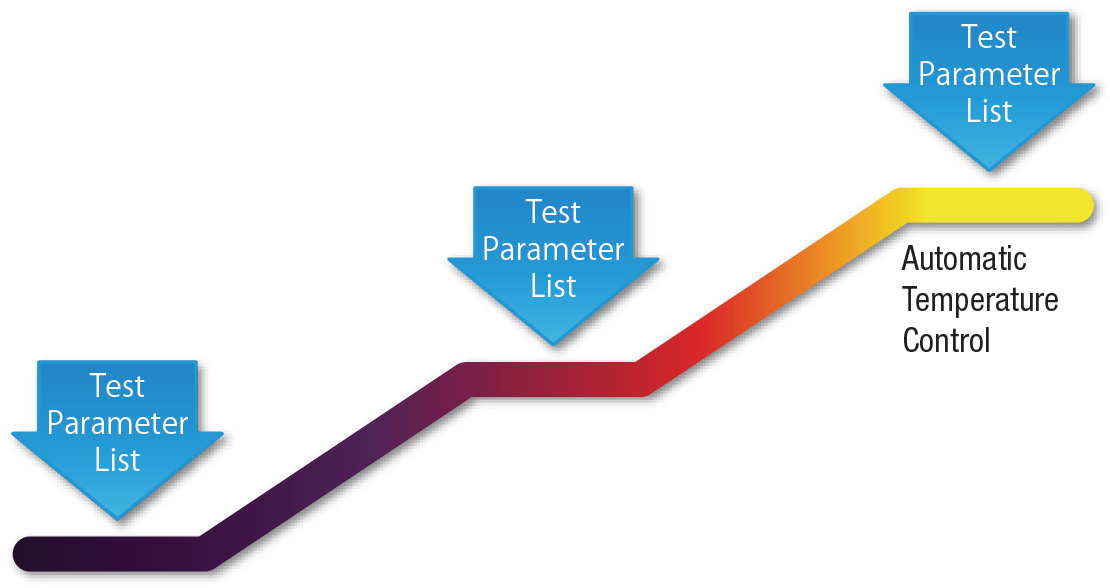
Temperature characterization of semiconductors
The CS-810 also controls the hot plate at the same time.
Time-consuming measurement of parameters for each temperature can also be fully automated.
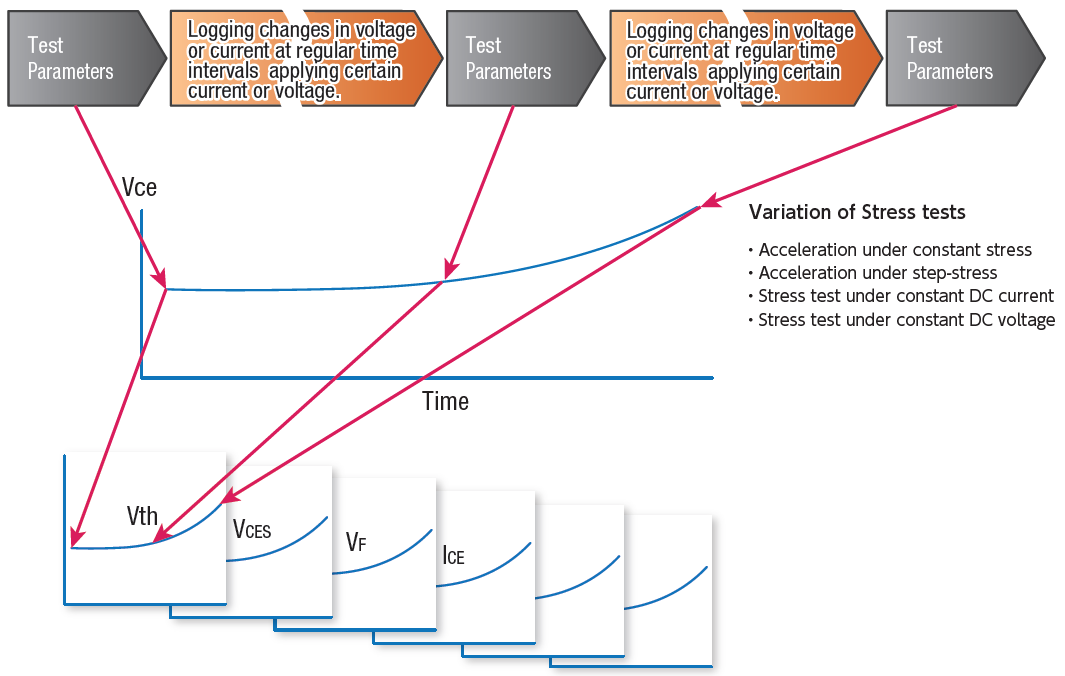
Stress testing
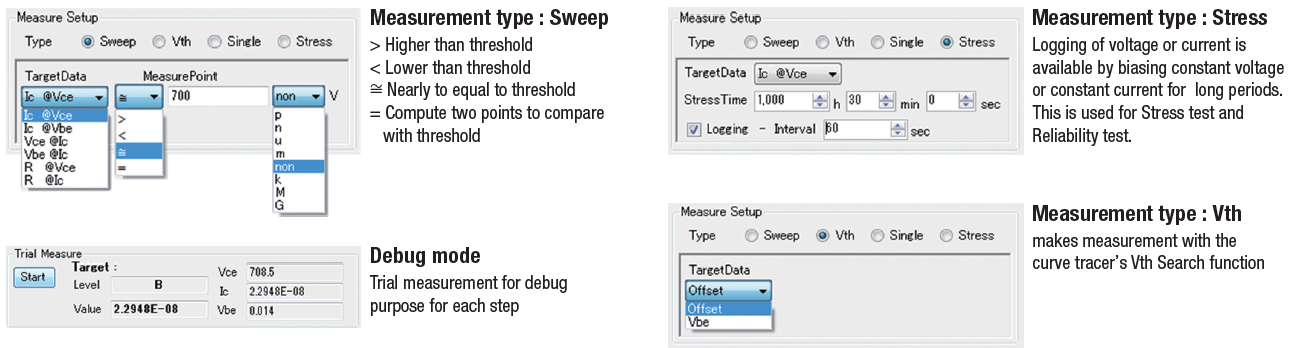
Various parameters can be incorporated into stress testing
- Long-term reliability testing is possible.
- Current and voltage are automatically monitored by the curve tracer side at all times, and current and voltage changes are logged.
- Various parameters can be automatically measured during and before and after the stress test.
- Set the lower and upper limits for both current and voltage, and stop the application when the limit is exceeded.
Hold a constant voltage or current (10 seconds to 1,000 hours)
Measure Ic and Vce (interval: 10 seconds to 2 hours)
Discrete device testing
Connect to measure multiple devices with one click
The same elements can be measured sequentially. The scanner system CS-700 series has 10CH. Fully automatic measurement of 10 elements, such as time-consuming temperature characteristics. The setting of the control software CS-810 is also completed when one element is copied.
*The CS-700 Series can operate up to 10 systems in parallel.
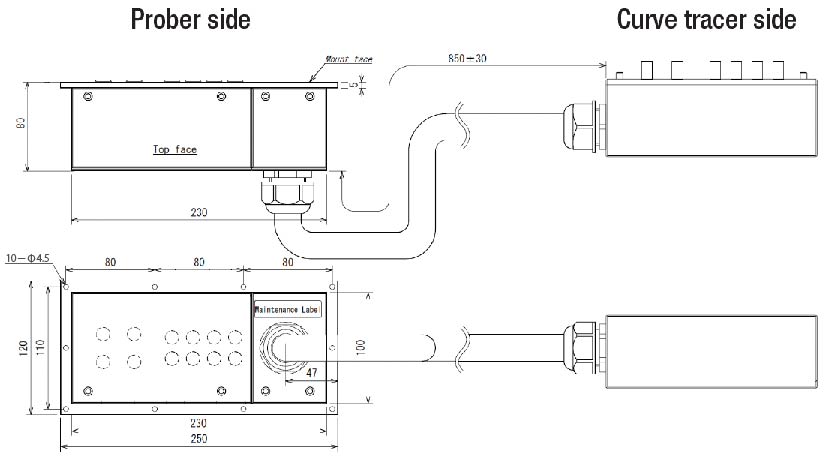
Response to wafer measurement
Measure device on wafer by coupling with probe system
Prober cableCS-306/308
Cable for connecting the probe to the curve tracer (equipped with an interlock terminal)